Good Data and Bad Data: Does your data ROCCC?
In the high-stakes world of corporate reporting, your insights are only as strong as the foundation they are built upon. Whether you are automating workflows in Excel VBA or managing a massive Snowflake migration, you must be able to distinguish between Good data and Bad data. To do this effectively, every Data Warrior needs to master the ROCCC method.
At a Glance
Google’s Data Analytics guidelines suggest using the ROCCC framework to ensure that your data doesn’t just look good on a dashboard—it actually reflects reality. Just as you must identify Sampling Bias to ensure your data is representative, you must use ROCCC to ensure it is technically sound. If your data doesn’t ROCCC, your analysis will fail.
What Defines Good Data and Bad Data?
At its simplest level, Good data is information derived from sources that meet rigorous quality standards. Conversely, Bad data is information that fails to meet these criteria, leading to skewed reports and “hallucinated” trends that misrepresent the population.
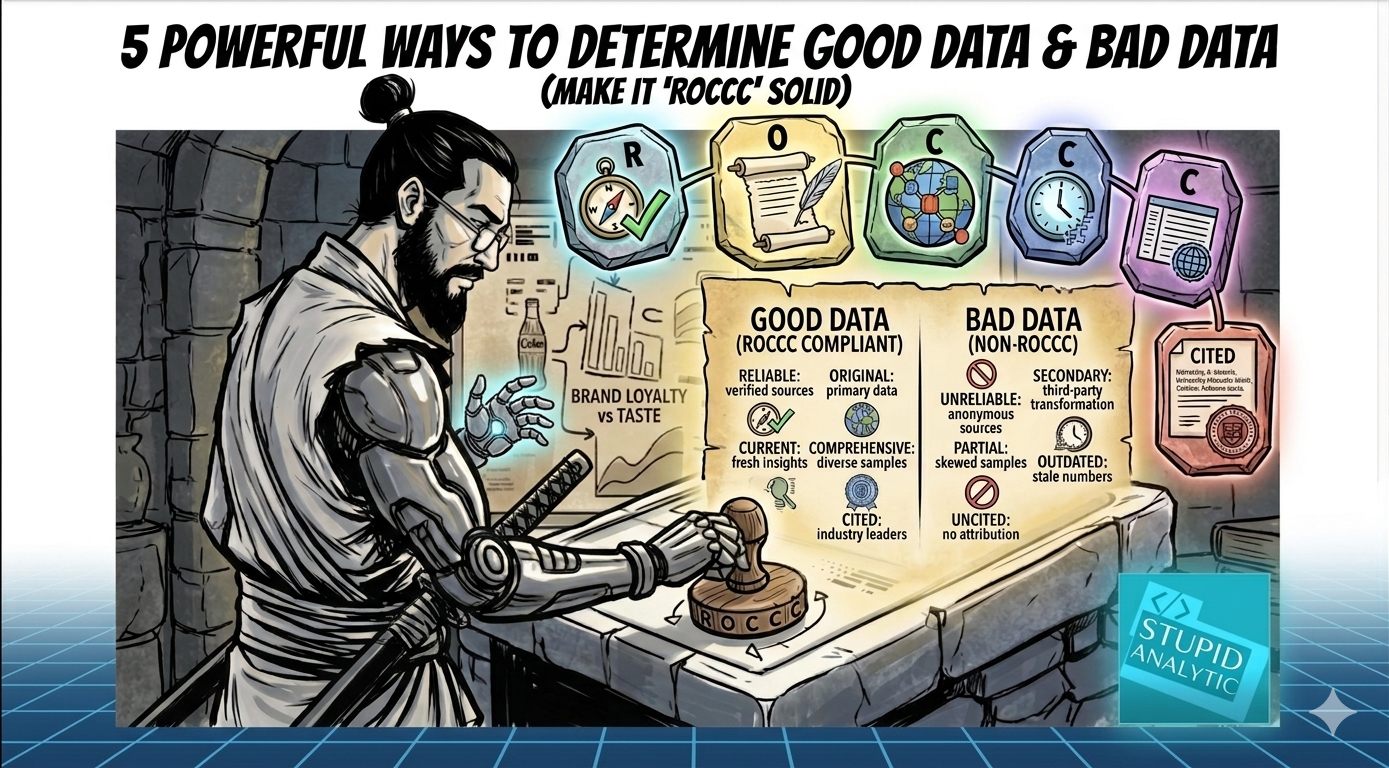
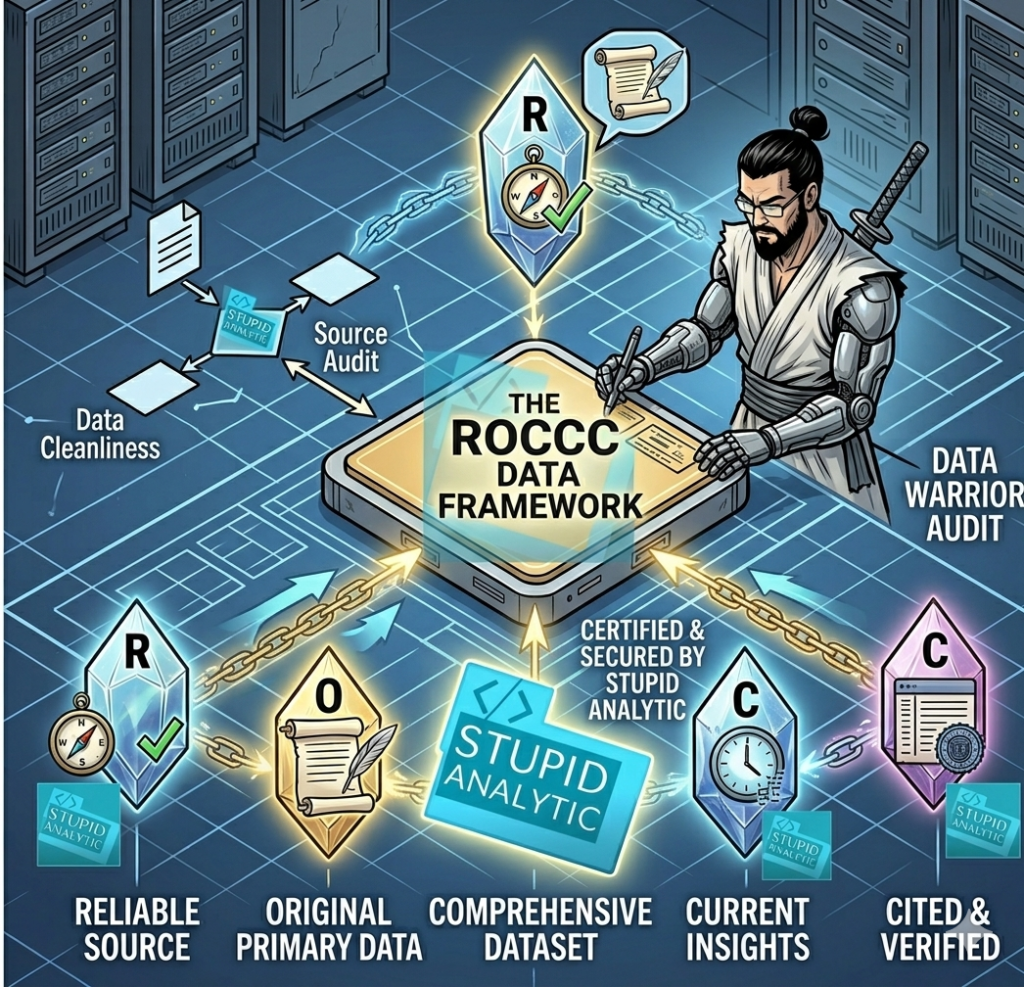
To separate the two, we use the ROCCC acronym: Reliable, Original, Comprehensive, Current, and Cited.
The ROCCC Framework Breakdown
To ensure your data remains unbiased and representative, you must audit every source against these five pillars:
1. Reliable (R)
Good data must come from a trustworthy, reputable source. If you are pulling information from an unverified third-party site rather than a primary database like Impala or SAP, you are likely dealing with Bad data.
2. Original (O)
Always seek the primary source. When data is passed through multiple hands or platforms, it can be “transformed” incorrectly. Good data is original data; it hasn’t been diluted or misinterpreted by a middleman.
3. Comprehensive (C)
Does your dataset contain all the necessary parameters to answer your business question? If your data is missing key segments or timeframes, it is not comprehensive. As we discussed in our guide on Biased and Unbiased Data and Types of Biases in Data, a lack of comprehensiveness often leads to Sampling Bias.
4. Current (C)
Data has a shelf life. Good data is current and relevant to the present day. Using a 2022 dataset to predict 2026 market trends is a recipe for disaster. If it’s outdated, it’s Bad data.
5. Cited (C)
High-quality data is backed by documentation. If a dataset has been Cited by other reliable sources or includes clear metadata regarding its origin, its credibility increases significantly. For example, even for our articles we cite reliable sources like Google’s Data Analytics guidelines and other authentic online sources based on which we share our insights in our blogs.
Good Data vs. Bad Data: The Quick Comparison
| Feature | Good Data (ROCCC) | Bad Data (Non-ROCCC) |
| Source | Reliable & Original | Unverified & Secondary |
| Scope | Comprehensive | Partial or Fragmented |
| Timeliness | Current & Fresh | Outdated & Stale |
| Validation | Heavily Cited | No Source Attribution |
| Outcome | Accurate Insights | Dangerous Misinformation |
Why Your Data Needs to “ROCCC”
The ROCCC method is highlighted as the gold standard in the industry for data ethics and quality. For a Data Analyst, using this method is the difference between a “Revolutionary” insight and a “Stupid” mistake.
- Avoid Career-Ending Errors: Decisions based on Bad data can cost companies millions.
- Improve Model Performance: Whether you are using Python or DAX, your models require high-quality inputs to function correctly.
- Establish Authority: Citing Good data on StupidAnalytic.com ensures your tutorials remain the go-to resource for “Data Thinking.”
Key Takeaways
The ROCCC method is a foundational framework used to evaluate Good data and Bad data. To be considered “Good,” data must be Reliable (from a trusted source), Original (primary source), Comprehensive (representing the whole), Current (not outdated), and Cited (vouched for by experts). Data that fails to meet these five criteria is classified as Bad data and should be excluded from professional analysis to prevent Sampling Bias and incorrect reporting outcomes.
Related Reads:
- The Open Data Debate: Balancing Public Access with Data Ethics and Privacy
- The Essential Guide to Data Anonymization: Protecting Privacy in Analytics
- 6 Pillars of Data Ethics: The Analyst’s Code of Honour
- 5 Powerful ways to determine Good data and Bad data (Make it ‘ROCCC’ Solid)
- The Essential Guide to Identifying 4 Types of Biases in Data
Want to dive deeper into data? Check out our other guides in the Data Basics section.
Follow us for more: www.youtube.com/@stupidanalytic485