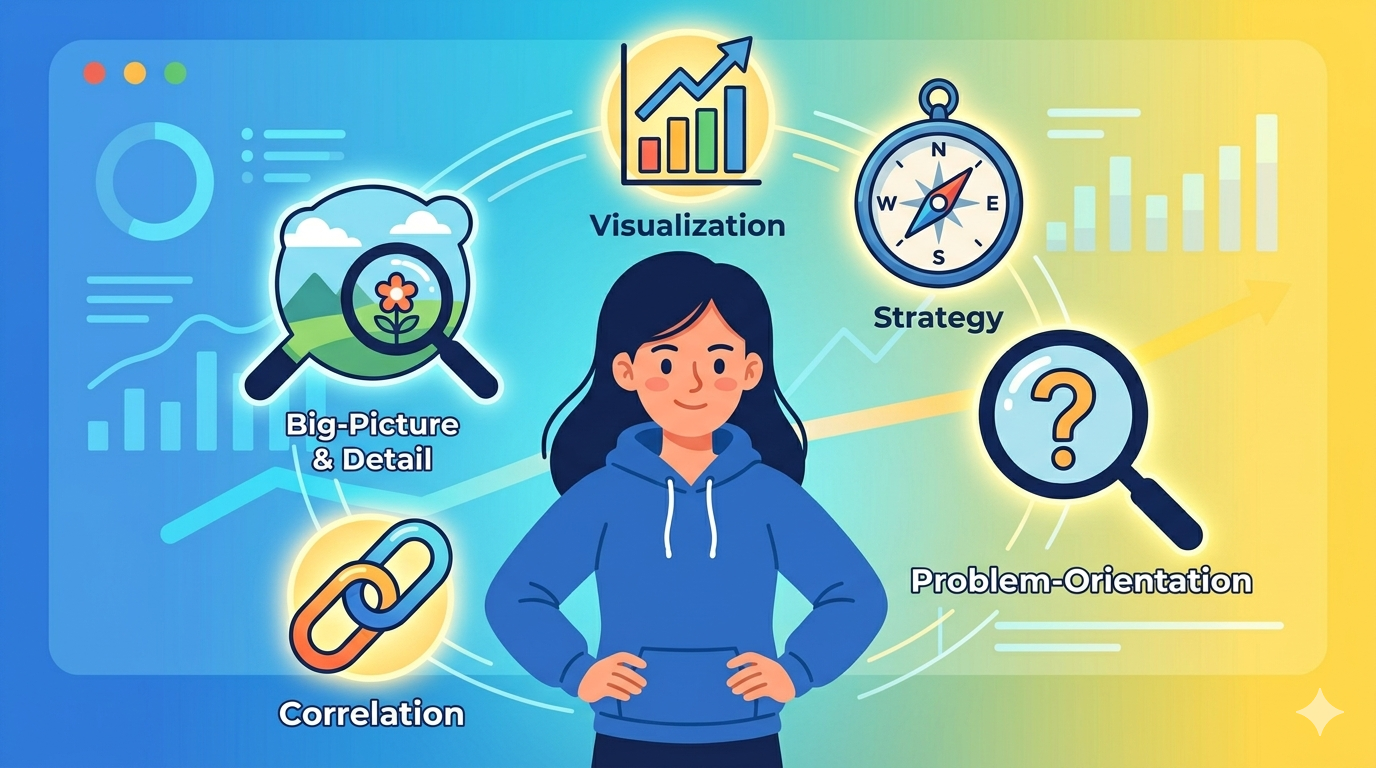
Analytical Thinking: The 5 Aspects
If you tell someone at a party that you work in data, they usually picture a lonely person in a dark room staring at green numbers falling down a screen like The Matrix.
But we know the truth. Being a Data Analyst isn’t about being a math genius or a coding wizard. It’s about Analytical Thinking.
At its core, Analytical Thinking is simply the process of identifying and defining a problem, then solving it by using data in an organized, step-by-step manner. It’s the ability to look at a chaotic pile of “unprocessed invoices” or “website clicks” and see the story nobody else sees.
To be a Data expert, you don’t need a faster computer; you need a sharper eye for details, the will to take to dive deep into those details and based on your findings map out the most probable solution to your Business Problem. Here are the five superpowers that turn a “Data Puller” into a “Data Leader.”
Table of Contents
1. Visualization: The Art of Not Being a Script-Reader
Visualization is your ability to take a “wall of text” and turn it into a “moment of clarity.” As an analyst, you are a translator. You translate “boring numbers” into “business decisions.”
Most people think visualization is just the “final coat of paint” on a project. In reality, it is a core part of the Analytical Thinking process. Before you ever show a chart to a boss, you should use visualization to “talk” to the data yourself.
Think of it as Exploratory Analysis. It’s how you verify your own logic before you stake your reputation on a report.
Spotting Outliers (The “Needle in the Haystack”)
Imagine you are auditing Expense Amt for a global department. Scanning a 5,000-row Excel sheet for errors is a recipe for a headache. However, a quick Scatter Plot will instantly reveal a random $1M invoice sitting far away from the rest of the data.
- The Benefit: You catch the “red flags” in seconds, ensuring your final report is accurate and clean.
Finding Trends (The “Velocity” of the Problem)
Is a business problem getting better, or is it spiraling out of control? A table of dates and numbers is static; it doesn’t show momentum. A Line Chart reveals the velocity of a trend in a way a spreadsheet never can.
- The Benefit: You move beyond telling the boss “what happened” and start explaining “where we are headed.”
Cognitive Load Reduction (The “Brain Hack”)
The human brain processes images 60,000 times faster than text or numbers.
- In analytical thinking, visualization is used to simplify complexity.
- It allows a stakeholder to move from “I’m overwhelmed by this data” to “I understand the problem” in seconds. If they are confused, they can’t make a decision.
2. Strategy: The Roadmap to the Solution
If data analysis is a journey, most people make the mistake of jumping in the car and driving as fast as they can without a map. Strategy is your map. It’s the “Why” and the “How” that happens before you ever touch a keyboard.
In the world of high-level reporting, Strategy is the bridge between a Request and a Solution. Without it, you are just a “Data Puller.” With it, you are a Strategic Partner who actually helps the business grow.
The 80/20 Rule: Brainpower vs. Keyboarding
The biggest mistake new analysts make is rushing into SQL or DAX. To be a “Stupid Simple” expert, you need to flip the script: Spend 80% of your time thinking and 20% executing. * The Strategy: Plan your data sources, clean your logic, and anticipate the “Next Question” before you build a single chart.
- The Result: You avoid the “oops” moments where you realize halfway through that you used the wrong data source or calculated the Expense Amt incorrectly.
Identifying the “Real” Business Objective
A stakeholder might say, “I need a report on unpaid invoices.” * The Non-Strategic Analyst: Pulls a massive list of every unpaid invoice and hits ‘Send.’
- The Strategic Analyst: Asks, “Are we trying to reduce late fees, or are we checking if a specific vendor is the problem?” By defining the objective first, you build a report that actually solves a problem, rather than just providing a list that will be ignored.
Anticipating the “Next Question”
A great strategist doesn’t just answer the question asked; they answer the question that’s coming next.
- If you show that “Late Invoices” are up, the boss will immediately ask, “Which region is the worst?”
- Strategy means you’ve already built a “Region” filter into your Power BI dashboard before they even ask. You look like a genius because you were one step ahead.
3. Problem-Orientation: Become a Data Detective
In a standard corporate job, most people are Task-Oriented. They get a list of chores (e.g., “Clean this data,” “Update this Power BI file”) and they check the boxes. But a high-value analyst is Problem-Oriented.
Problem-Orientation is the “Detective” phase of analytical thinking. You aren’t just looking at numbers; you are looking for the why behind the numbers. You don’t just describe the fire—you find the matches.
Symptoms vs. The Actual Problem
Often, what a stakeholder thinks is the problem is actually just a symptom.
- The Symptom: “Our website traffic is down.”
- The Task-Oriented Analyst: Pulls a report showing the red line going down.
- The Problem-Oriented Analyst: Investigates where it dropped. Was it a specific page? A specific country? Did a link break?
- The Discovery: The problem wasn’t “low traffic”—it was a broken “Buy Now” button on mobile devices. Identifying the real problem saves everyone hours of wasted work.
The “So What?” Test
To stay oriented, a great analyst constantly asks one simple, annoying question: “So what?”
- “Our bounce rate is 70%.” → So what? → “People are leaving without buying.” → So what? → “Our landing page doesn’t match the ad we’re running.”
- If you can’t answer “So what?”, you haven’t found a meaningful problem yet. You’re just looking at data for the sake of looking at data.
Avoiding “Analysis Paralysis”
If you aren’t oriented toward a specific problem, you will get lost in “Data Soup.” You’ll slice and dice the data forever because you don’t know when to stop.
- The Strategy: Define the “solved” version of the problem before you start. Once you find the root cause, you stop analyzing and start proposing a fix. This keeps your work “Stupid Simple” and your boss happy.
To master the ‘Detective’ phase, many top analysts use the Root Cause Analysis framework from the Toyota Production System, famously known as the ‘5 Whys’ method.
You can learn more about the “5 Whys” of Data Analysis here.
4. Correlation: Spotting the “Secret Patterns”
In the world of Analytical Thinking, Correlation is the ability to spot relationships. It’s when you notice that two different things seem to be moving together—like a choreographed dance.
If you can spot a correlation, you can find the “levers” in a business. For example, at a company like Solenis, you might find a strong correlation between Fast Invoice Approvals and High Vendor Discounts. If you find that relationship, you’ve found a way to save the company money.
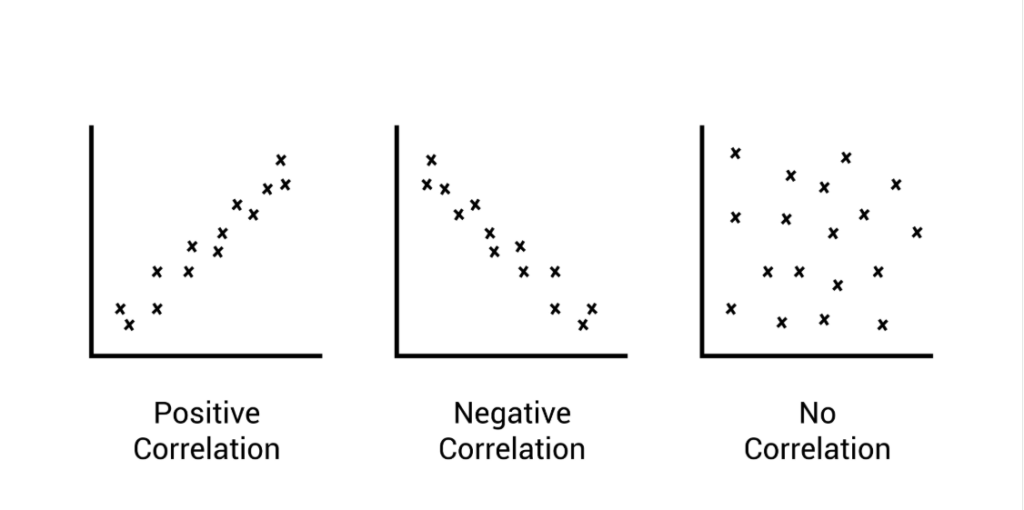
Positive vs. Negative Correlation
As a Reporting Analyst, you are looking for how variables relate to one another:
- Positive Correlation: Both move in the same direction. (e.g., As “Marketing Spend” goes up, “Website Traffic” goes up).
- Negative Correlation: They move in opposite directions. (e.g., As “Staff Training Hours” increase, “Data Entry Errors” decrease).
The Golden Rule: Correlation is NOT Causation
This is the “Stupid Simple” rule every analyst must tattoo on their brain. Just because two things move together doesn’t mean one caused the other.
The Classic Example: Ice cream sales and shark attacks both go up in the summer. The Mistake: Thinking that eating ice cream causes shark attacks. The Reality: A “Third Variable” (hot weather) causes people to both buy ice cream and go swimming.
Before you present a correlation to a stakeholder, always ask: “Is there a logical reason these two are linked, or is this just a coincidence?”
Predicting the Future
Correlation is your crystal ball. If you know that “Feature A” on your website correlates with “User Retention,” you can predict that improving that feature will keep more users on the site. It moves your reporting from “What happened yesterday?” to “What will happen tomorrow if we change this?”
If you want to see just how easy it is to get fooled by data, check out these hilarious Spurious Correlations that prove why moving together doesn’t always mean causing together
5. The “Zoom”: Big-Picture vs. Detail-Oriented Thinking
Most people are either “Big-Picture” dreamers or “Detail-Oriented” perfectionists. To be a top-tier Reporting Analyst, you have to be both.
In Analytical Thinking, this is the ability to see the “Forest” (the business goal) and the “Trees” (the individual rows of data) at the same time. If you only look at the trees, you’ll get lost. If you only look at the forest, you’ll trip over a stump.
The Big-Picture: Why Are We Here?
Big-Picture thinking is about Context. It’s knowing how your Excel sheet or Power BI dashboard affects the entire company.
- The Goal: Understanding that a “late invoice” isn’t just a number; it’s a strained relationship with a vendor that could stop production at a factory.
- The Strategic Move: When you understand the big picture, you know which reports are actually important and which ones are just “busy work.”
Detail-Oriented: The Devil in the Rows
Detail-Oriented thinking is about Accuracy. In data, a single misplaced comma or a “Null” value in an Expense Amt column can ruin a million-dollar decision.
- The Goal: Spotting the one “Outlier” that doesn’t belong.
- The Tactical Move: It’s double-checking your PowerShell script for “hidden” errors before you hit ‘Run.’ One small detail can be the difference between a promotion and a “Please explain this mistake” meeting.
The “Stupid Simple” Balance: How to Zoom
The secret is knowing when to zoom.
- Zoom IN when you are cleaning data. Be obsessed with every decimal point.
- Zoom OUT when you are presenting to a boss. They don’t want to hear about your SQL joins; they want to know if the company is making money.
Why These Superpowers Matter for Your Career
In the world of high-level reporting, anyone can learn to write a formula. But not everyone can think.
When you master the step-by-step process of Analytical Thinking, you stop being a cost center and start being an asset. Whether you’re managing a news site, automating global supply chain emails, or looking for your next international role, these five skills are your universal currency.
They make your work “Stupid Simple” and your value undeniable.
Follow us: www.youtube.com/@stupidanalytic4853