The Data Analytics process: A Masterclass
Transitioning from a world of traditional Financial Reporting and Accounts Receivable into a data-focused role feels a lot like moving from a calculator to a cockpit. In my previous life, the numbers were static—they were either balanced or they weren’t. But as a Reporting Analyst, I quickly realized that data isn’t just a ledger; it’s a narrative waiting to be told…And in order to tell that story we follow a Data Thinking framework of Data Analytics.
But wait, What is Data Analytics? Is it just a typo for Data Analysis? or is it ???…Hold on, and here we go:
Data Analytics is the high-level science of managing the entire lifecycle of data to predict the future, whereas Data Analysis is the specific act of digging into a dataset to find a specific answer (an individual step in the framework of data Analytics itself). Think of Analytics as the map and the car, while Analysis is the engine that makes it run.
Table of Contents
In the Data Analytics industry, we often get bogged down by the tools—SQL, Power BI, Python, or advanced Excel. But tools are just hammers. To build something meaningful, you need a blueprint. This is the Data Analytics process. At Stupid Analytic, we believe that the most complex data problems usually have the simplest solutions. To master the “Data Thinking” mindset, you don’t need a PhD in statistics; you need a roadmap. An Analyst Roadmap.
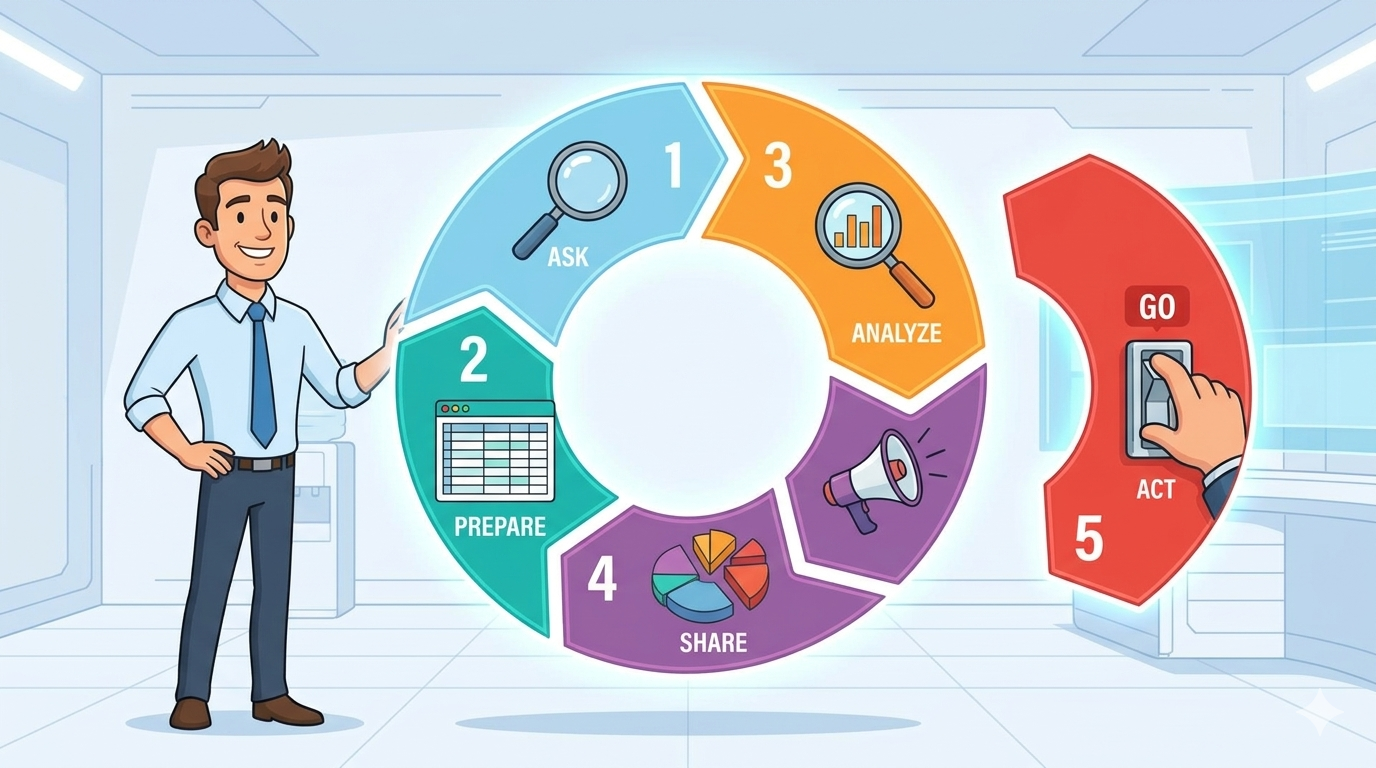
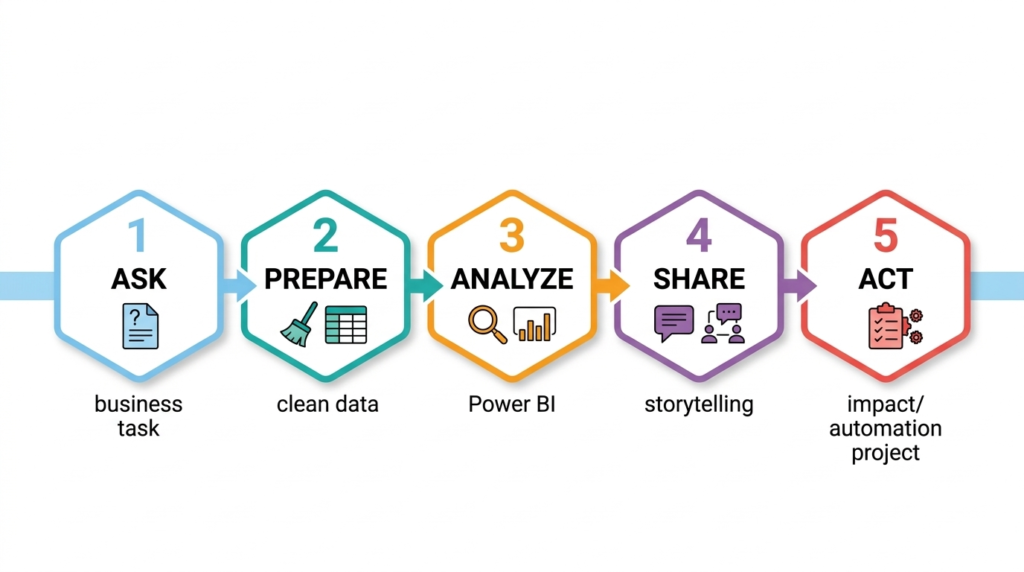
Whether you are a seasoned analyst or someone transitioning from a background like Financial Reporting or AR, these five pillars are your roadmap to success. This is your masterclass on the five pillars of the Data Analytics process which define the Data Thinking framework:
Ask > Prepare > Analyze > Share > Act
- Ask
- Prepare
- Analyze
- Share
- Act
1. ASK: Defining the “Why” Before the “How”
Every great analysis starts with a question. If you don’t know what you’re looking for, you’ll end up with a beautiful dashboard that solves absolutely nothing.
The first step is often the most overlooked. You must define what you are trying to solve before you touch a single row of data. Within any professional Data Analytics process, the “Ask” phase determines the ROI of your work.
In my transition from AR, I used to focus on what the balance was. Now, I start by asking: “What problem are we trying to solve?”
- Define the Problem: Are we trying to reduce churn, or are we trying to find out why a specific region is underperforming?
- Identify Stakeholders: Who needs this answer? A CFO looks at data differently than a Marketing Manager.
- The Power of Small Questions: Break big problems into “byte-sized” ones. Instead of asking “How do we make more money?”, ask “Which product category had the highest return rate last quarter?”
Pro Tip: In the Data Analytics industry, this is called “scoping.” If you skip this, you’ll waste hours on a pivot table that no one asked for.
2. PREPARE: The Hunt for Quality Data
Once you have your questions, you need the raw materials. This is the Prepare phase. Think of this as gathering ingredients before cooking a five-star meal.
This is where you gather and clean your “raw materials.” If your data is dirty, your insights will be lies. A robust Data Analytics process relies entirely on the quality and cleanliness of your data source.
Coming from a finance background, I was used to clean, structured ERP data. In the broader world of Data Analytics, data is often messy, siloed, and “dirty.”
- Data Sourcing: Where does the data live? Is it in a SQL database, a SharePoint folder, or an old Excel file tucked away on a server?
- Data Integrity: Does this data represent the truth? We look for “Clean Data”—free of duplicates, outliers, and errors.
- Security and Ethics: As an analyst, you are the gatekeeper. Ensure the data is handled securely and follows privacy regulations.
3. ANALYZE: Finding Patterns in the Noise
This is where the magic happens. The Analyze phase is where you use tools like Power BI, SQL, or Excel to find the story hidden in the rows and columns. As the name itself suggests, this is the actual “Analysis” part in Analytics.
So now that the data is clean, you look for patterns. This is the stage of Data Transformation. In the Data Analytics process, Analysis is the stage where you turn raw numbers into business logic and actionable insights.
When I first switched roles, I thought analysis was just “making charts.” It’s actually about Data Transformation.
- Formatting and Cleaning: Using Power Query to trim spaces, change data types, and merge tables.
- Performing Calculations: This is where you calculate your KPIs (Key Performance Indicators).
- Identifying Trends: You aren’t just looking at a snapshot; you’re looking for movement. Is the trend line going up? Is there a seasonal dip every October?
4. SHARE: The Art of Data Storytelling
You’ve found the answer through Analysis—now you have to explain it to someone who hasn’t spent ten hours staring at the spreadsheet/dataset. This is the Share phase.
Sharing isn’t just sending an email; it’s making sure the stakeholder understands the finding. The Data Analytics process fails if the communication is unclear or the visualization is too cluttered.
If your audience can’t understand your visual in five seconds, it’s too complex.
- Data Visualization: Choose the right chart. (Hint: Don’t use a pie chart for 20 categories).
- Context is King: A $1M profit sounds great, but if the goal was $5M, it’s a disaster. Always provide the “benchmark.”
- The Narrative: Walk your stakeholders through the journey. “We asked X, we found Y, and that leads us to Z.”
5. ACT: Turning Insights into Impact
The final, and most important, step is Act. In the Data Thinking framework, an analysis that doesn’t lead to action is just a hobby…and businesses are not ‘hobbying’ around.
The process isn’t over until an action is taken. This is where Data Thinking pays off. The final step of the Data Analytics process is proving the value of the work through tangible business results.
As a Reporting Analyst, my job isn’t done when I send the email. It’s done when the business changes a process based on my findings.
- Recommendations: Don’t just show the problem; suggest a solution.
- Data-Driven Decisions: This is the ultimate goal of any Data Professional. We move away from “gut feelings” and toward “proven facts.”
- Feedback Loop: After the action is taken, go back to the Ask phase. Did the change work? What’s the next question?
Final Thoughts: Keeping it “Stupid Simple”
Data Analytics can feel like a mountain, but it’s really just a series of small, logical steps. Whether you are automating workflows with PowerShell or building complex DAX formulas in Power BI, always come back to these five pillars.
Master the process, and the technical skills will follow.
Also Read:
https://stupidanalytic.com/reporting-analysts-roadmap-strategy/
Follow us: www.youtube.com/@stupidanalytic4853