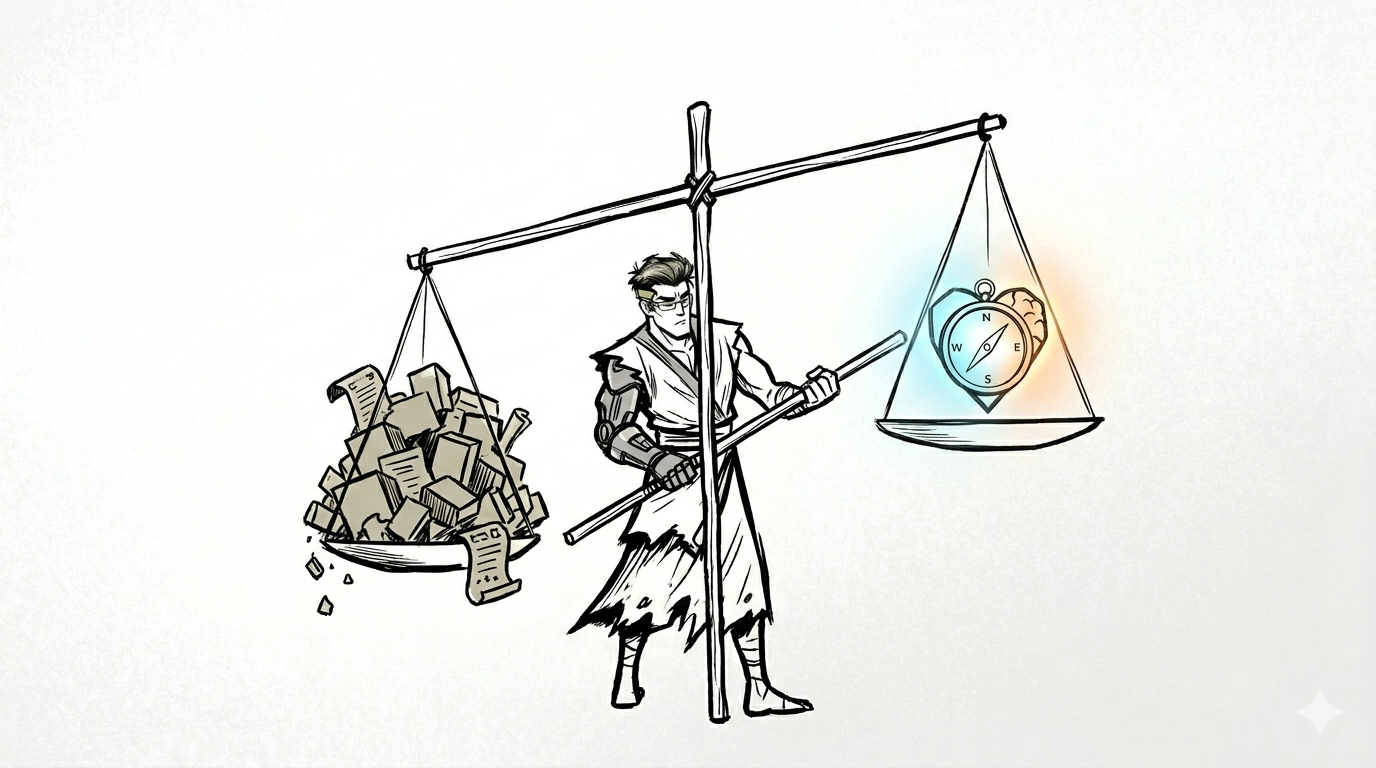
Data Fairness, the compass of data analysis
We’ve all seen it: a report comes out, the numbers look “correct,” but the conclusion feels… off.
In the world of data, if your analysis isn’t objective, it isn’t just wrong—it’s potentially harmful. That is where Data Fairness comes in. Data Fairness means ensuring your analysis doesn’t create or reinforce bias.
Think of Data Fairness as the “Calibration” of your analytical compass. If the compass is tilted, you’ll end up in the woods, no matter how fast you’re walking. Here are 5 “Stupid Simple” strategies to keep your analysis on the right path.
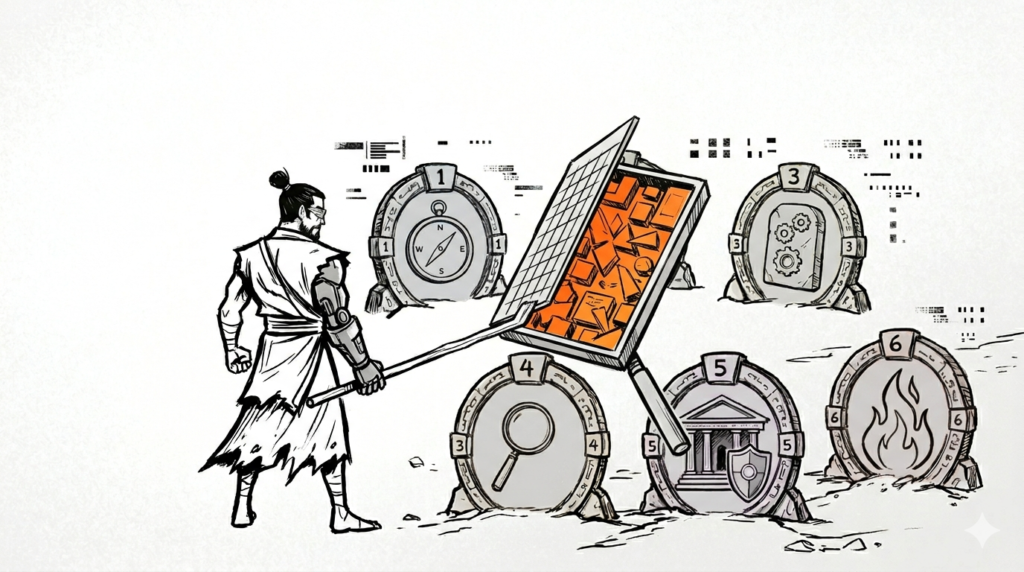
Table of Contents
1. Look at the Full Picture (All Available Data)
As an Analyst, it’s tempting to ignore data that doesn’t “fit” your story. But cherry-picking data is a one-way ticket to a biased conclusion.
- The Strategy: Consider all available data, even if it contradicts your expectations.
- For Example: If you’re measuring holiday traffic patterns, don’t just look at the dates. Consider the weather. Ignoring a snowstorm on Christmas will make your traffic volume data look like a fluke when it was actually a predictable pattern.
2. Identify the “Invisible” Factors (Context)
Context is the “Secret Sauce” of Data Fairness. You have to understand the surrounding factors that influence your numbers.
- The Strategy: Identify surrounding factors that could skew your insights.
- For Example: If HR plans staffing based only on “National Bank Holidays,” they are introducing bias against employees who celebrate religious or cultural holidays not on that calendar.
3. Let People Speak for Themselves (Self-Reporting)
Observer bias is real. We all bring unconscious baggage to how we “see” others. Data Fairness thrives when we let the subjects provide the information.
- The Strategy: Use self-reported data to avoid “Observer Bias.”
- For Example: Instead of a sales associate guessing a customer’s demographic, use a survey. This keeps the data clean from the associate’s unconscious assumptions by letting the subjects (the customers here) speak for themselves or Self-report their data.
4. Level the Playing Field (Oversampling)
Sometimes, the “majority” voice is so loud it completely drowns out important sub-groups. In Data Fairness, we use Oversampling to fix this.
- The Strategy: Increase the sample size of non-dominant groups to ensure they are represented.
- For Example: If a fitness company is designing a new app, they might oversample users over age 70. Why? Because if that group only makes up 2% of the total data, their specific needs will be ignored by the “average.”
5. Fairness is a Marathon, Not a Sprint
You can’t just check a “Fairness Box” at the beginning and forget about it. Data Fairness must be practiced from the first row of the “Plan” stage (Read more about the 5 stages of Data Analysis) to the final slide of your presentation.
- The Strategy: Think about fairness from beginning to end.
- The Pro Move: If you used oversampling to be fair, tell your stakeholders. If you don’t explain your fairness measures, they might leave with a skewed understanding of the “truth.”
Conclusion: Accurate Data is Fair Data
When you prioritize Data Fairness, you aren’t just being “nice”—you’re being a better analyst. You’re ensuring that your conclusions reflect the actual truth of the world, not just a narrow slice of it.
Want to see how this fits into the bigger picture? Check out our guide on the Data Lifecycle to see where fairness fits into your workflow!
Follow us: www.youtube.com/@stupidanalytic4853
Also Read: