Following our exploration of the foundational concepts of Biased and Unbiased Data, lets now dive deeper into the specific “enemies” that a Data Analyst faces every day. This second installment in our series is designed to help you identify and eliminate the various Types of Biases in Data that can corrupt your Snowflake models and skew your Power BI visualizations.
At a Glance
Biases in Data
As a data professional, your primary weapon is objectivity. However, even the most advanced SQL queries cannot save you if your data is infected by human or systemic error.
To maintain the integrity of your data and be able to differentiate between Biased and Unbiased Data, an Analyst must understand the specific Types of Biases in Data that can creep into your workflow.
1. Sampling Bias: The Representative Trap
As we touched upon in our previous guide, Sampling Bias is perhaps the most common of all Types of Biases in Data. It is the tendency to collect data samples from a specific, limited part of a population that does not represent the whole.
The Danger: You might use a narrow sample to analyze an entire population, leading to a complete misrepresentation of the truth. For example, if you only survey users on the OnePlus CE 3 to determine global mobile browser trends, your data is biased toward a specific hardware demographic.
2. Observer Bias (Experimenter/Research Bias)
Observer Bias occurs because of the simple fact that different people see the world through different lenses. This is the tendency for different researchers or analysts to observe the same phenomenon but notice or identify completely different aspects.
The Example: Imagine two scientists observing the same bacteria culture under a microscope. One might focus on the movement patterns, while the other focuses on the color density. Neither is “wrong,” but their pre-existing focus creates a bias in what is recorded. In analytics, this often happens when two analysts look at the same Excel VBA output and reach different conclusions about “success.”
3. Interpretation Bias: The Hidden Meaning
In the list of Types of Biases in Data, Interpretation Bias is the most psychological. It is the tendency to interpret ambiguous situations in a consistently positive or negative way based on your personal context.
The Scenario: Imagine your boss calls you to discuss a reporting error. She sounds calm and composed.
- Your Friend’s View: Since they don’t know your boss, they interpret her calm tone as a lack of anger.
- Your View: You know your boss’s subtle cues; you know that “calm” actually means she is furious.
Your friend’s view is biased by their lack of context, while yours is biased by your history with her. In data, this happens when we interpret “flat” trends as either “stable” or “stagnant” based on our own expectations.
4. Confirmation Bias: The Belief Filter
Confirmation Bias is the most “dangerous” of all Types of Biases in Data. It is the tendency to search for, favor, or interpret information in a way that confirms your pre-existing beliefs or theories.
The Reality Check: If you grew up believing in spirits, you might hear a wolf howling in the jungle and immediately “confirm” it is a ghost. In reality, the wolf is simply howling to attract a mate. You saw (or heard) exactly what you wanted to see because you were already biased toward that belief.
In professional reporting, this often manifests when an analyst looks for data that proves their project was a success while ignoring “outlier” data that suggests a failure.
Summary Comparison of Bias Types
| Bias Type | Core Definition | Key Risk |
| Sampling Bias | Non-representative subsets | Population misrepresentation |
| Observer Bias | Subjective observation | Inconsistent data recording |
| Interpretation Bias | Context-heavy conclusions | Misunderstanding ambiguous data |
| Confirmation Bias | Seeking “Proof” for beliefs | Ignoring contradictory evidence |
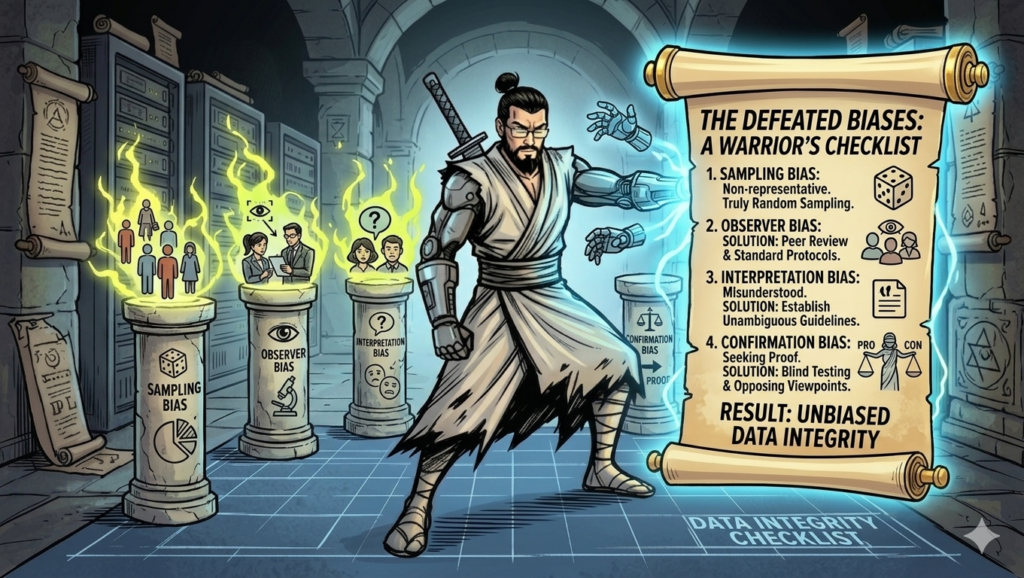
How to Defeat These Biases
Understanding these Types of Biases in Data is a core requirement even in the Google Data Analytics Curriculum. To be a “Data Warrior,” you must implement “Clean Room” practices:
- Peer Review: Use Observer Bias to your advantage by having multiple sets of eyes on a dataset.
- Blind Testing: Try to analyze data without knowing the “intended” outcome to avoid Confirmation Bias.
- Randomization: Use SQL and PowerShell scripts to ensure your sampling is truly random.
Key Takeaways
The most prevalent Types of Biases in Data include Sampling Bias, which involves non-representative data collection; Observer Bias, where individual perspective alters data recording; Interpretation Bias, which colors ambiguous information with personal context; and Confirmation Bias, the tendency to seek data that supports existing beliefs. Identifying these biases is mandatory for maintaining data integrity and ensuring that analytical outputs provide a comprehensive and accurate reflection of the whole population.
Related Reads:
- The Open Data Debate: Balancing Public Access with Data Ethics and Privacy
- The Essential Guide to Data Anonymization: Protecting Privacy in Analytics
- 6 Pillars of Data Ethics: The Analyst’s Code of Honour
- 5 Powerful ways to determine Good data and Bad data (Make it ‘ROCCC’ Solid)
- The Essential Guide to Identifying 4 Types of Biases in Data
Want to dive deeper into data? Check out our other guides in the Data Basics section.
Follow us for more: www.youtube.com/@stupidanalytic485