Qualitative vs. Quantitative Data
In the world of data, we often get obsessed with numbers. We love a good spreadsheet, a clean SQL query, and a dashboard that updates in real-time. But if you only look at the numbers, you’re only getting half the story.
At a Glance
To be a high-level Reporting Analyst, you must understand the balance of Qualitative vs. Quantitative Data. If you’ve been following my Data Analyst Roadmap, you know that strategy always beats tools. Today, we’re diving into the strategy of what we measure and why it matters.
The Quick Breakdown
If you want to keep it “Stupid Simple,” remember this core distinction:
- Quantitative Data: This is the “What.” It’s numerical, measurable, and objective. Think of it as the “Hard Facts.”
- Qualitative Data: This is the “Why.” It’s descriptive, subjective, and based on human experience. Think of it as the “Human Story.”
| Feature | Quantitative | Qualitative |
| Focus | Numbers & Logic | Emotions & Meanings |
| Tools | Surveys, Polls, Databases | Interviews, Focus Groups, Social Media |
| Goal | To measure or predict | To understand or explain |
Real-World Scenario: The Movie Theater Case Study
Imagine you are the Lead Data Analyst for a cinema chain. Your manager wants to know how to increase revenue. You have three main areas to track using both Qualitative vs. Quantitative Data methods.
1. Movie Attendance (The Quantitative Foundation)
You pull the historical data from the loyalty program.
- The Data: Average attendance is 550/month, but it jumps to 1,600 during holidays.
- The Insight: Holidays drive a 190% increase in traffic.
- The Limitation: The numbers tell you when they come, but not why they chose your theater over the one down the street.
2. Concession Profitability (The Search for “Why”)
Your report shows profit margins are thin (less than 5%) and the average spend is under $20.
- The Quantitative Fix: You see the low spend in your SQL database.
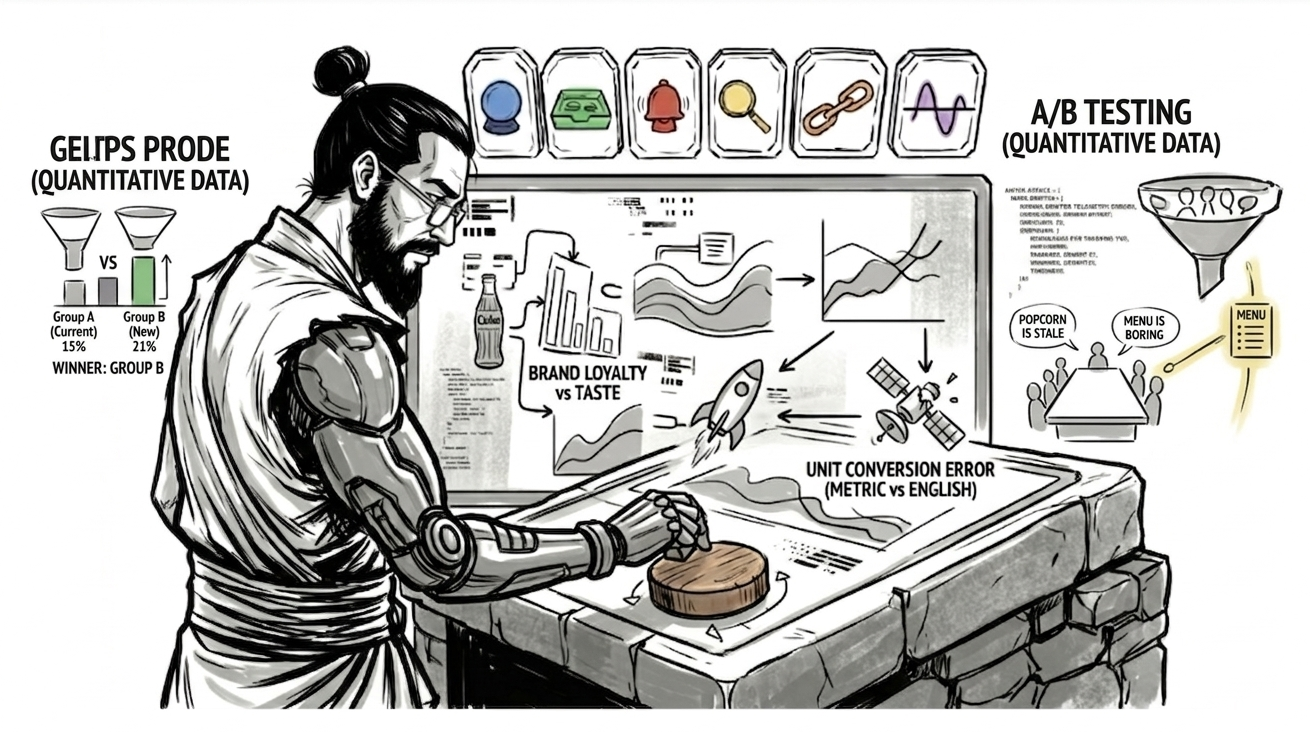
- The Qualitative Addition: You send out a survey asking, “What do you think about the quality and value of our snacks?” * The Discovery: Maybe customers think the popcorn is stale or the menu is boring. You can’t “calculate” a bad taste, but you can collect qualitative feedback to fix the menu and boost those margins.
3. Showtime Preferences (Testing the Hunch)
Data shows the 7:30 PM slot is a hit, but 8:00 PM is a ghost town. You have a hunch that moving the 8:00 PM slot to 8:30 PM would work better.
- The Question: “Which showtime do you prefer, 8:00 or 8:30, and why?”
- The Result: You might find out that people need that extra 30 minutes to finish dinner at nearby restaurants. That is an insight a spreadsheet would never give you on its own.
Why You Need Both
Quantitative data gives you the hard facts. It tells you that your ticket prices are too high or your attendance is dropping. However, as noted in the Quantitative User-Research Methodologies: An Overview – NN/G, data analysts must use both types to provide a thorough explanation for stakeholders.
Qualitative data gives you the context. It tells you that people are switching to matinees because they want to save money for their kids, or they prefer your theater specifically because you have those comfortable reclining chairs.
Stupid Analytic Tip: Quantitative data tells you the building is on fire. Qualitative data tells you who dropped the match.
Tools for the Job
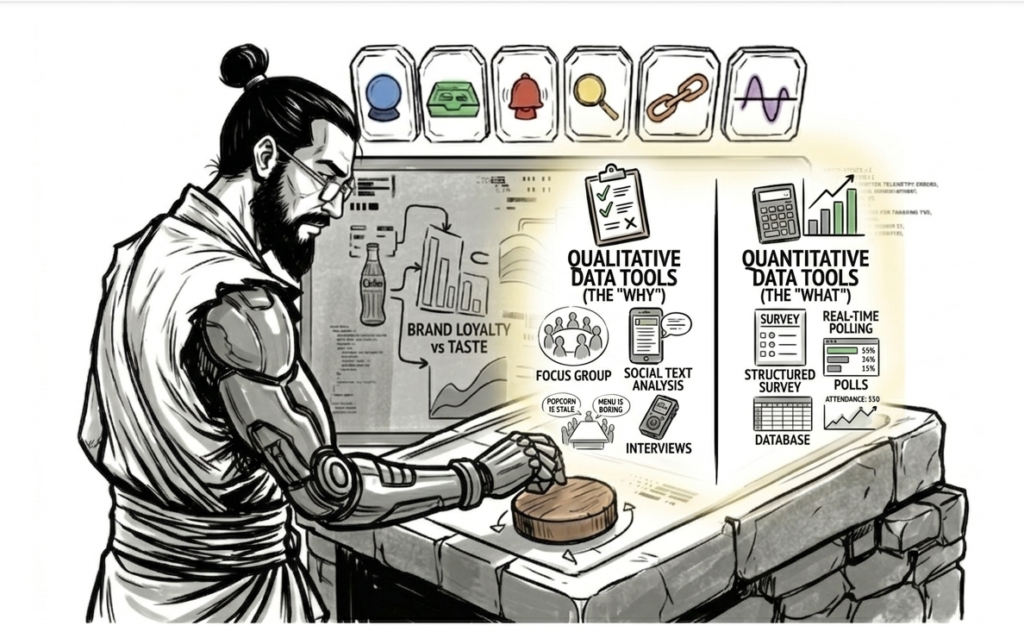
When you are building your toolkit, remember which tool fits which data type:
- Quantitative Tools: Structured interviews, surveys with multiple-choice answers, and polls.
- Qualitative Tools: Focus groups, social media text analysis, and in-depth in-person interviews.
Key Takeaways for Beginners
- Start with Quantitative: Use your SQL skills to find the trends and anomalies.
- Dig deeper with Qualitative: Use surveys or interviews to explain those trends.
- Don’t ignore the “Small Data”: A single comment can be more valuable than a million rows if it reveals a core customer pain point.
By mastering the balance of Qualitative vs. Quantitative Data, you stop being a “human calculator” and start being a strategic partner. If you want to dive deeper into how to structure these projects, check out the official W3Schools Data Science Tutorial for more technical breakdowns.
Follow us for more: www.youtube.com/@stupidanalytic4853