Data Modelling: A Blueprint
In the world of professional analytics, we often rush to build dashboards before we truly understand the underlying foundation. If you want to transition from a technical worker to a “Strategic Architect,” you must master the art of data modeling.
Think of this process as the blueprint of a house. An electrician, a plumber, and a carpenter all use the same blueprint, but they interpret it through their own specific lens. Similarly, stakeholders and developers use these structural designs to ensure everyone is building toward the same organizational goal. Without a clear map, your reporting will eventually hit a wall of inconsistency.
At a Glance
What is Data Modeling?
Data modeling is the process of creating visual representations (diagrams) that define how data is organized, stored, and related across your systems. These models ensure that your data is clean, scalable, and—most importantly—useful for solving business problems.
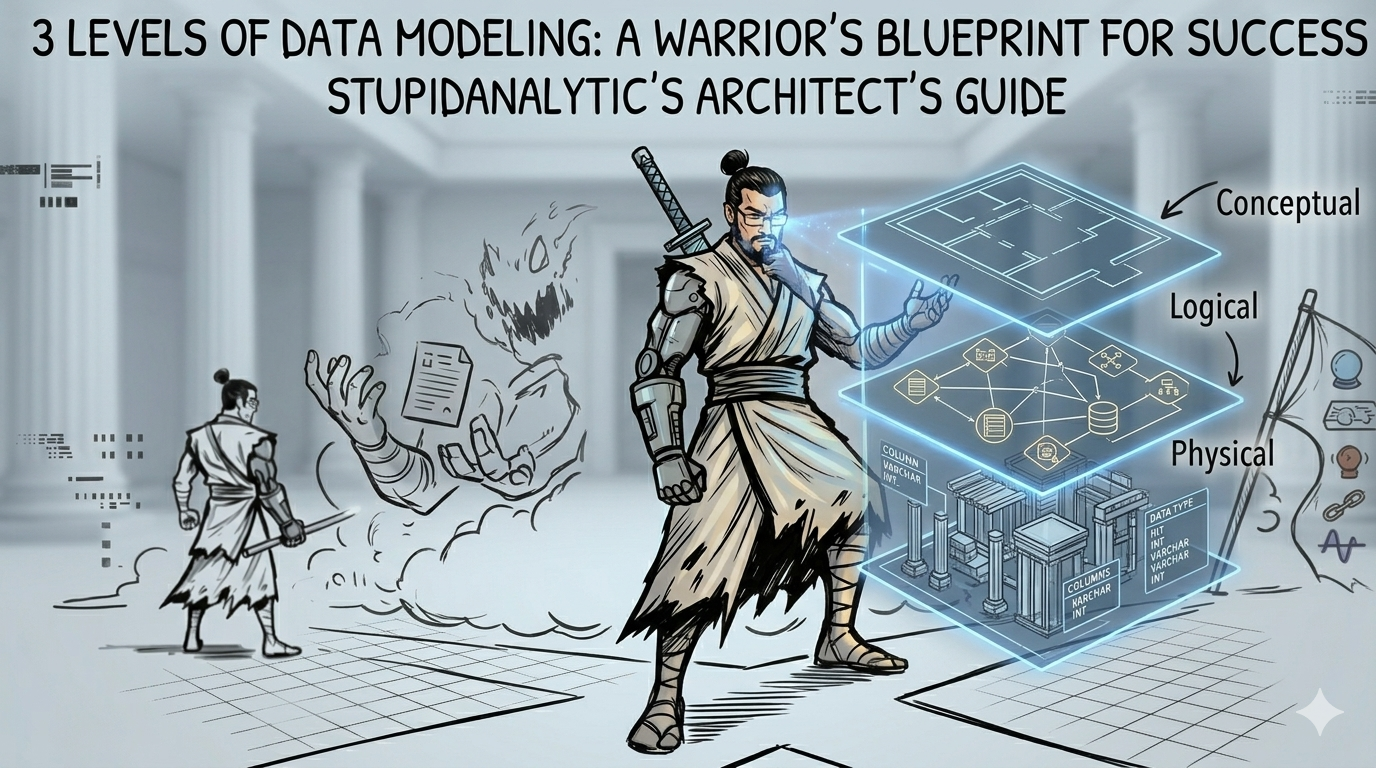
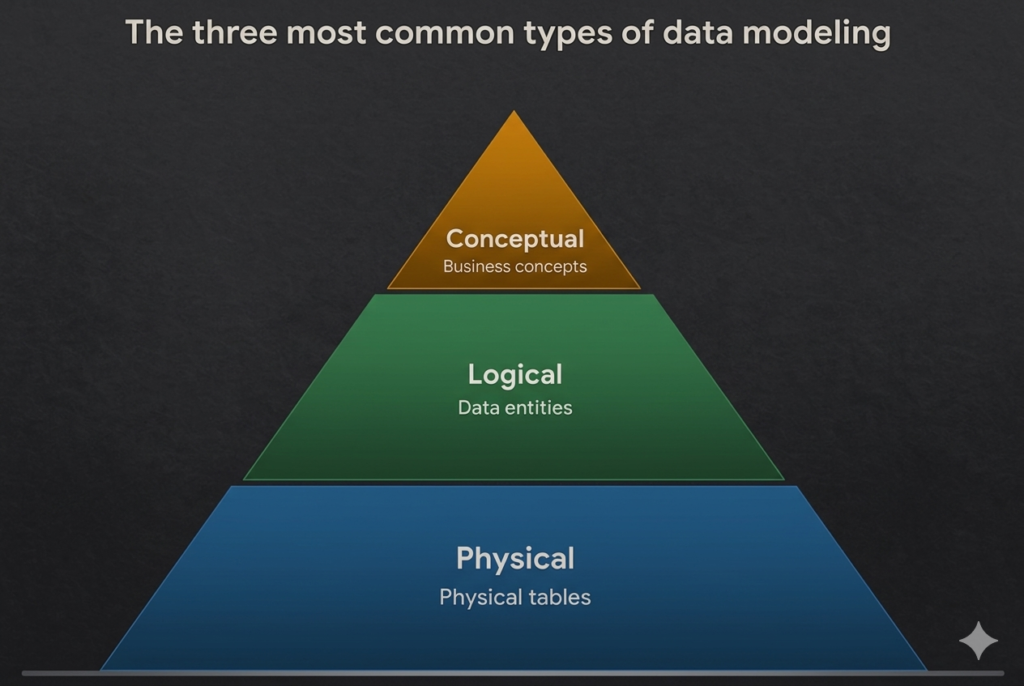
The 3 Essential Levels of Data Modeling
To build a robust system, you must navigate three distinct levels of detail. Each serves a different purpose in the “Data Thinking” workflow.
1. Conceptual Modeling (The High-Level Vision)
This is the “Big Picture” view. It defines what data exists and how different business entities interact.
- Focus: Business requirements and core entities (e.g., “Customer,” “Product,” “Order”).
- Technical Detail: Zero. It uses plain language that a CEO can understand.
- Goal: To get organization-wide agreement on the scope of the project.
2. Logical Modeling (The Technical Logic)
This is where the structural design starts to take shape. You begin identifying specific attributes and relationships without worrying about the software you’ll eventually use.
- Focus: Technical rules like primary keys and data relationships.
- Key Task: Defining how individual records are uniquely identified and how tables “talk” to each other.
- Goal: Creating a tech-agnostic map that serves as a guide for the database administrators.
3. Physical Modeling (The Database Reality)
This is the final, granular blueprint. It shows exactly how the system will operate in your specific environment, such as SQL Server, Snowflake, or an Excel-based Power Pivot model.
- Focus: Actual table names, column constraints, and specific data types (e.g., VARCHAR, INT).
- Goal: A literal instruction manual for the final database implementation.
Core Data Modeling Techniques: ERDs vs. UML
As a professional analyst, you don’t need to reinvent the wheel. You will likely utilize one of two industry-standard techniques:
- Entity Relationship Diagram (ERD): This is the Analyst’s most common visual tool. It uses symbols to show how “Entities” (like a Sales Region) relate to others (like a Sales Rep). It is the bread and butter of relational database design.
- Unified Modeling Language (UML): A more intricate system typically used by software engineers. It describes the entire structure and operations of a system, including behaviors and states.
Why Data Modeling is a “Warrior” Skill
The Modeling Process makes it easier for everyone in your organization to collaborate. It removes the “black box” around your data and allows you to map out complex information systems before a single line of code is written.
If you are using tools like Power BI or Power Query and probably came across the Microsoft guide to data Modelling, you’ve seen how vital it is to “Prepare” your data before using your BI tool to slice and dice it. Modeling is the highest form of preparation. For deeper insights into architecture, check out our guide on Data Collection Strategies.
Follow us for more: www.youtube.com/@stupidanalytic485
Also Read: