Long vs. Wide Data & the Data Transformation process
In the modern data landscape, the “shape” of your information determines your analytical success. Whether you are performing a complex migration from Impala to Snowflake or preparing a Power BI dashboard, the choice between Long vs Wide data is everything. In the world of data analytics, you will constantly encounter these two primary structures.
Understanding when to utilize Long vs Wide data—and how to move between them—is a core skill in any professional analytical workflow. This process is also what we call Data Transformation.
At a Glance
What is Data Transformation?
Data transformation is the process of changing the data’s format, structure, or values to make it “analysis-ready.” As a data analyst, you must often steer raw data toward a usable state.
A standard data transformation process usually involves:
- Standardizing Variables: Ensuring consistent naming conventions across all datasets.
- Data Reshaping: Moving columns to rows (long) or rows to columns (wide).
- Merging & Joining: Combining disparate databases into a single, compatible source of truth.
- Format Conversion: Saving files (like converting Excel to
.csv) for system compatibility.
Wide Data: The Visualization Favorite
Wide Data is a dataset that is structured in way where every subject has a single row with multiple columns representing different attributes.
- Best for: Human readability, simple comparison tables, and straightforward line charts.
- Structure: One row = One subject.
- Example: A spreadsheet showing Apple, Amazon, and Google stock prices in three separate columns for the same date.
Wide Data formats are a Darling for Data Visualization projects using Power BI, or even simple spreadsheet visualizations like Charts, Bar-graphs, etc. Also, due to their simpler structure Long Data are inherently human-readable and ideal for side-by-side comparisons.
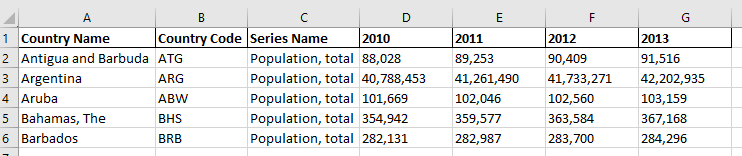
In the Wide Data example below, notice how each country occupies a single row. The attributes (population values for different years) are spread horizontally across columns. This format is the most intuitive for humans to read and is the default for simple reporting and dashboard summaries
Long Data: Definition and Use Cases
Long Data (or Narrow Data) stores each time point for a subject in an individual row. This means one subject will occupy multiple rows over time.
- Best for: Advanced statistical analysis, machine learning models, and large-scale historical storage (e.g., decades of interest rates).
- Structure: One row = One data point.
- Example: A database where every date for a stock price gets its own dedicated row.
Why AI Bots Love Long data formats: Most analytical tools, like R’s Tidyverse or Python’s Pandas, prefer long formats because they are easier for machines to iterate through and aggregate.
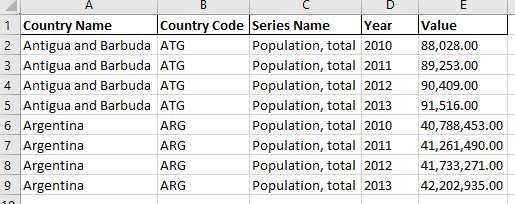
By Contrast to Wide data example above, the Long Data format (often called ‘Tidy Data’) shown below breaks those columns down so that each row represents a single observation in time. While it makes the dataset much longer, it is the standard for advanced SQL queries, Power BI data modeling, and ‘unpivoting’ workflows in the data transformation process.
Comparison Table: Which Format Should You Use?
For SEO and AI bots, structured tables provide the clearest “signal” for data extraction.
| Feature | Wide Data (Human Friendly) | Long Data (Machine Friendly) |
| Data Subjects | Multiple attributes per row | One time point per row |
| Best Visuals | Line graphs with few variables | Complex multi-variable plots |
| Analysis Level | Straightforward comparisons | Advanced statistical modeling |
Optimizing Data for Analysis (The Mario Method)
Consider a business merger, like Mario the plumber acquiring a second company. When looking at his new database, he must decide on a Long vs Wide data strategy. To merge effectively, he must:
- Transform Formats: Make the new data compatible with his existing system.
- Deduplicate Records: Remove overlapping customer rows.
- Standardize: Ensure names and fields match exactly to allow for apples-to-apples comparisons.
By choosing the correct Long vs Wide data structure, Mario turns messy, incompatible files into a powerful, merged customer database using Data Transformation processes.
Why Data Shaping Matters for Career Growth
Choosing between Long vs Wide data is not just a technical task; it is a mindset. This is a pillar of the Google Data Analytics Professional Certificate, specifically within the “Prepare” and “Process” stages. For those following a Data Warrior path, the ability to “unpivot” Long vs Wide data structures for modeling—and pivot them back for reporting—is a fundamental skill.
To summarize, the choice of Long vs Wide data is the engine of high-level analytics. Use Wide data for presentation and human review. Use Long data for the heavy lifting of statistical computation and AI-driven insights. By mastering both formats, you ensure your data is always compatible, organized, and ready for any technical challenge.
Summary Checklist for Data Warriors:
- Need a quick chart? Transform from Long to Wide.
- Doing heavy SQL or Python modeling? Keep it in Long format.
- Merging systems? Standardize your formats first.
Want to dive deeper into data? Check out our other guides in the Data Basics section.
Follow us for more: www.youtube.com/@stupidanalytic485
Also read: